Lake Level Bottoms Out
The lowering in the surface level of Crater Lake recorded during the last few years could be over. A return to a more average winter pattern where snowfall amounts exceed 500 inches has already been realized in 1992-93. This snowpack, and any additional precipitation, should all but stop the decline in lake level observed since 1986.
The rise and fall of Crater Lake’s level this century is connected closely to the fluctuations in the region’s weather. Lake levels have been observed and recorded since early this century. Crater Lake was at its deepest in March of 1975 when the lake level measured 6179 feet above mean sea level. This is 16 feet above its lowest point, which was measured in early September of 1942. In 1959, when the U.S. Geological Survey measured the depth of the lake and found it to be 1,932 feet deep, the lake level was 6,176 feet above sea level. This is a good indication that the lake level is always in flux.
Lake level is primarily affected by annual precipitation. For the lake to retain the same level observed the year before, 66 inches of precipitation must be recorded at Park Headquarters. This would come largely as snow and approximates to roughly 530 inches of annual snowfall. If more is received, the lake will be higher during the following summer. If less is recorded, the lake level will fall. A declining lake level has been the case for the last six years. Only 243 inches of snow fell from July 1, 1991 to June 30, 1992. In late September of 1992, at the end of the water year, Crater Lake’s level fell below 6,169 feet. This is close to levels seen in the 1940s and therefore represents a fifty year low. Crater Lake has, however, not been alone among lakes in the region. Upper Klamath Lake and reservoirs throughout southern Oregon also dropped to levels not seen for decades.
If precipitation patterns observed earlier this century are used, Crater Lake will require six years of greater than average snowfall to regain the volume of water lost since 1986. It is likely that the lake will take many more than six years to reach higher levels again. Forecasting future weather patterns and associated lake levels is, at best, risky. Nevertheless, we seem to be at the end of a dry cycle that has been expressed by a drop in Crater Lake’s surface level.
Crater Lake Surface Variation
September 30th
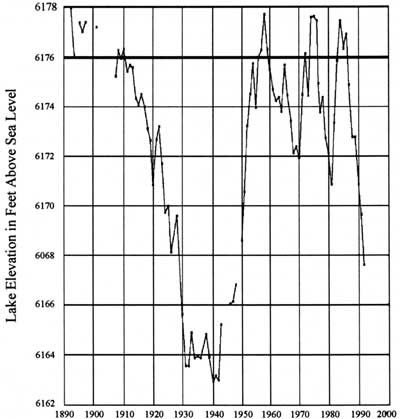
Observed elevation of the lake surface this century. The surface elevation of 6,176 feet is 1,932 feet above the deepest part of the lake. Gaps in the chart are due to periods when measurements were not taken.
Annie Spring Responds to Long-term Drought and Municipal Water Use
Crater Lake National Park has recently experienced one of the most significant droughts in recorded history. The total precipitation of the past three water years is the lowest three-year sum since records began at Park Headquarters in 1931. Surface elevation of the lake itself has cropped from 6,178 feet in 1984 to less than 6,168 feet in 1992.
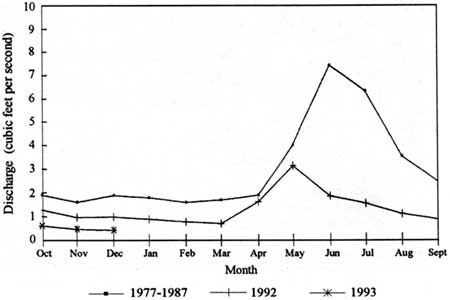
Water for park municipal use is drawn from Annie Spring, the headwaters of Annie Creek. The U.S. Geological Survey has maintained a gauging station on Annie Creek since 1977, shortly after the park moved its water intake facility from Munson Spring to Annie Spring. The gauging station is located directly beneath the road crossing several hundred feet belong Annie Spring. Although the water intake is located at the spring origin, there are no discharge data for this site. The origin is not the creek’s sole source of water, as stream discharge increases several fold between the spring and the road crossing. Nevertheless, discharge data is taken at the gauging station in cfs (cubic feet of water per second) during the water year, which runs from October 1 to September 30.
During the winter of 1993, Annie Creek discharge is expected to drop to its lowest level in the 16 year period for which records have been kept. A typical hydrograph, or flow pattern, for the creek shows flow decreasing through the fall and winter, reaching minimum values in March or April (see chart). Spring flow responds rapidly to snow melt increasing in April or May and peaking in June. Estimated flow values for December 1992 (.43 cfs) are 23% of the 1977-1987 mean for December (1.9 cfs). Discharge values for 1977 through 1991 are adjusted to include water withdrawal from the spring. Values for 1992 and 1993 represent gauge recordings plus estimated water withdrawal rates based on preliminary data analysis.
Although discharge is currently low, this is not the first time low flows have been recorded. Minimum gauge values of .41 cfs end .39 cfs were recorded on March 18, 1989, and April 29,1991, respectively. No water intake problems were noted during 1989 and 1991. Municipal water withdrawal has increased from approximately nine million gallons in 1990 to over 13 million gallons in 1992, compounding trends in reduced spring discharge. Water use increased in each of the three developed areas that withdraw water from Annie Spring (Munson Valley, Rim Village, and Mazama Village). There were no dramatic increases in water use in Munson Valley, Rim Village and Mazama Village during fall and winter 1990-1992. Mazama Village was open, however, for the first time during the months of November and December in 1992. The most dramatic seasonal increases in water use occurred in Mazama Village and Munson Valley in June, July, and August. Water use increased in Mazama Village from approximately 500,000 gallons in July, 1990, to 1,100,000 gallons in July, 1992. In Munson Valley water use increased from approximately 370,000 gallons in August 1990, to 990,000 gallons in August 1992. There is a trend toward increased water use during the winter months. This trend is expected to continue during the winter of 1993 (without water conservation) as Sleepy Hollow housing area at Park Headquarters is near full occupancy.
Accumulated snow fall as of January 12,1993, was above the long-term average for that date. If snow fall trends continue, Annie Spring will recharge and attain average or higher flow rates corresponding closely in time with snow melt. The timing of snow melt, however, can only be approximated
In summary, during the winter of 1993, Annie Spring will likely reach the lowest recorded discharge values since the gauge was installed in 1977. Compounding this problem is increased municipal water use and water withdrawal from the spring. The creek appears to have adequate flow to meet water demands, though the current catchment and withdrawal system is probably not adequate to capture enough flow if current water use and spring flow trends continue. The design of the water system obviously warrants re-visiting, especially with more park development proposed and increased visitor use projected. In light of this new information, it is advisable to make new projections of future water use to determine if Annie Spring can support water withdrawal projections without violating water right allocations or instream flow requirements for channel processes and stream biota.
Annie Creek
Mean Monthly Discharge (cfs)
By Water Year