
Draft Winter Use Plan, Crater Lake National Park, Oregon, 1994
Chapter 1. Introduction
CRATER LAKE NATIONAL PARK VISITATION
The data in this analysis provide a general overview of past park visitation and are used to generate conservative visitation estimates. Because data collection is sometimes affected by weather and snow conditions on park roads, the data should be considered as one indicator of potential year-round and winter visitation and must be viewed in context with statewide and regional winter recreation projections.
Annual Visitation
The number of annual recreation visits to Crater Lake National Park fluctuated during the period from 1983 through 1993 (see Figure 1-3). Figure 1-3 indicates that visitation has fluctuated annually between a high of 525,441 in 1991 to a low of 419,914 in 1993. Table 1-1 shows that the total number of annual visitors to Crater Lake National Park remained relatively stable during the 11-year period from 1983 through 1993, decreasing by an average of .2% annually. Visitation declined by an average of 1.6% annually during the 5-year period between 1989 and 1993.
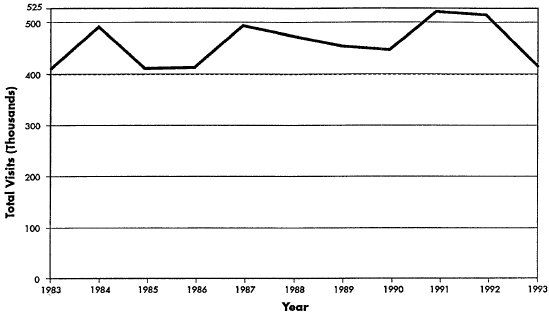
Figure 1-3. Crater Lake National Park Annual Visits,, 1983-1993.
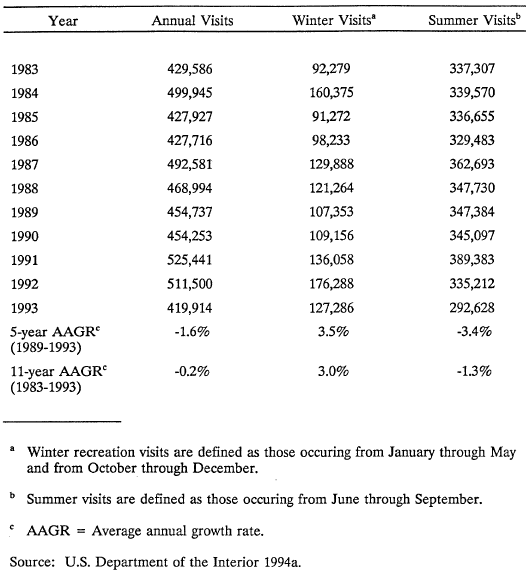
Table 1-1. Recreation Visitors to Crater Lake National Park.
Winter and Summer Visitation
Figure 1-4 shows the number of winter recreation visits from 1983 through the 1993 winter seasons. As shown, winter visitation has ranged from a low of 91,272 during 1985 to a high of 176,288 during 1992. Park staff attribute the 1992 figure to low snow levels which allowed summer visitors to access the park earlier in the season. Table 1-1 shows that the number of winter recreation visits increased by an annual average of 3.5% between 1989 and 1993 and by 3.0% between 1983 and 1993.
The number of summer recreation visitors declined by an annual average of 3.4% from 1989 to 1993 and by 1.3% between 1983 and 1993.
***previous*** — ***next***