
MATERIALS AND METHODS
The study area was within Crater Lake National Park, located within the southern Cascade Range in Oregon (Figure 1). Sample elevations ranged from 1400 to 1900 m. Five of the most common understory tree species that would be affected by prescribed or prescribed natural fires were chosen for analysis: white fir (Abies concolor (Gord. & Glend) Lindl.), Shasta red fir (Abies magnifica Murr. var. shastensis Lemm), ponderosa pine (Pinus ponderosa Dougl.) lodgepole pine (Pinus contorta Dougl. var. nmaryana Grev. & Balf.), and mountain hemlock (Tauga mertensiana (Bong.) Carr.).
Species, height class, and overstory class were controlled in the experimental design. For each of the five species, three height classes were defined: 0-1 m, 1-2 m, and 2-3 m. Subjectively chosen “open” and “closed” overstory classes were also defined, as a factor that might influence biomass of a given height class of a species through nutrient, light, and moisture competition. Five replications of each species within a given overstory density and height class were collected, for a total of 30 trees per species and 150 trees overall.
White fir trees were sampled from Abies concolor habitat types dominated by ponderosa pine and white fir. Lodgepole pine and Shasta red fir were sampled from the upper boundary of Abies concoZor habitat types into Tsuga mertensiana habitat types. Lodgepole pine is clearly a seral component of these communities; Shasta red fir has been described as both seral and climax in this area (Franklin and Dyrness, 1973). Mountain hemlock was sampled from Touga mertensiana habitat types and ponderosa pine was collected in Pinus ponderosa habitat types.
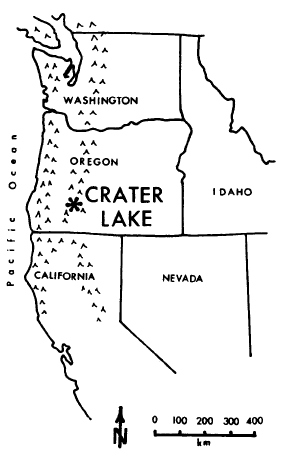
Figure 1. Crater Lake National Park, Oregon.
Within a given sample location, open and closed canopy areas were located and trees were chosen to fit into the selected height classes. A selected tree was excised and basal diameter (to 0.1 cm) and height (to 0.1 m) were measured. Basal area was measured with a 10 factor metric prism from the stump of the excised tree to provide later quantification of the overstory classification. The excised tree was then segregated into the following diameter size classes:
Live fuels: foliage; 0-0.63 cm; 0.64-2.53 cm; 2.54-7.61 cm;
and 7.62-20.32 cm
Dead fuels: 0-0.63 cm; 0.64-2.53 cm
The size classes correspond to fuel moisture timelag classes in the National Fire-Danger Rating System (Deeming et al., 1977). Although live fuels were segregated into these fuel moisture timelag size classes, they do not, as live fuels, exhibit the timelags which apply to the moisture relations of dead fuels only. Samples were bagged and carried to the laboratory for dry weight determination; no subsampling was attempted.
Most fuel size class segregation was completed in the field, but some needle segregation was completed in the laboratory. Samples were oven-dried at 65 degrees C for a minimum of 48 hours; the larger fuel sizes (up to 9.5 cm diameter) were dried for at least 120 hours after being air-dried for at least 60 days. The basal section of each tree was aged using a dissecting scope.
The analysis was conducted in two phases. The first phase was designed to test the significance of species, height class, and overstory class on the dependent variable, oven-dry biomass. A balanced, three-way ANOVA with 5 replications per cell was employed for three dependent variable combinations: live foliar biomass, all live fuel, and total biomass. These results were then used to see which species could be lumped for biomass prediction regressions and which independent variables might best be used in the regressions. Logarithm transformations (base 10) were made to meet the ANOVA assumptions, as unequal variances existed in the untransformed data. Orthogonal contrasts were computed to differentiate the species’ main effects. Results are significant at alpha < 0.05.
Linear regression analyses for biomass prediction were done using a combination of additive, multiplicative, and natural logarithmic transformations to normalize the data and correct for nonhomogeneous variance. These transformations are listed with the individual equations. Dependent variables (Y) were biomass of individual or combined fuel classes, and age; independent variables (X) included ground diameter, total height, a combination of diameter and height, and point estimates of basal area (BA). All intercept (a) values listed for ln-in equations were adjusted for logarithmic bias (Baskerville, 1972) by adding the correction term (S2y.x/2). The general forms of the biomass equations are:
lnY = a + blnX
lnY = a + bilnX, + b2lnX2
Other pages in this section