
|
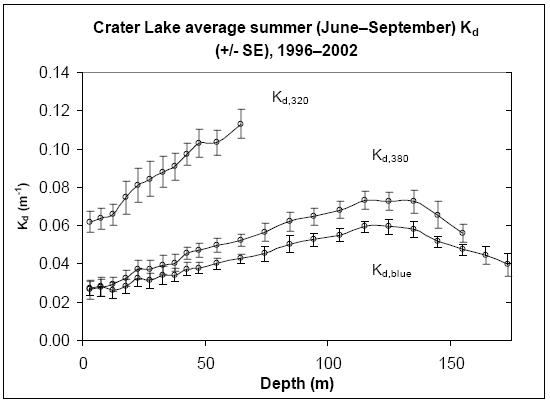
Figure 5. Average Kd for three wavebands versus depth in Crater Lake (June–September 1996–2002, LI-1800uw data, N=15 dates, bars indicate +/- S.E.) showing the summer pattern with minimum Kd at the surface and maximum Kd at the deep chlorophyll maximum (DCM). Kd,blue was calculated for the irradiance waveband 400–500 nm while Kd,320 and Kd,380 were calculated using the average from 2 nm above to 2 nm below the central wavelength. The average value for Kd,320 near the surface (0–5 m) was 0.062 m-1. |
 |
|
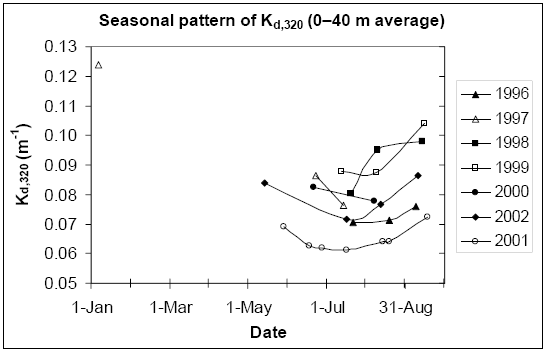
Figure 7A. Seasonal pattern of Kd,320 in Crater Lake, 1996–2002 (averaged 0–40 m). Typically the minimum Kd occurred in July or August. The highest Kd values during this period were in 1998–1999, the lowest in 2001. |
 |
|
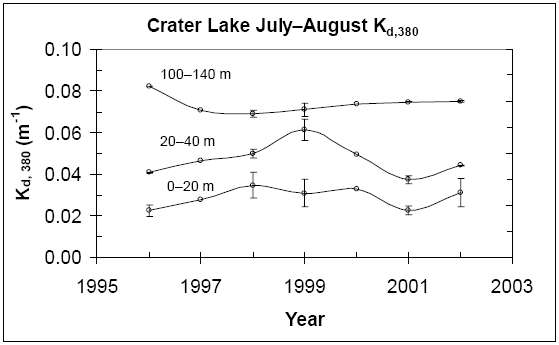
Figure 7B. Interannual variation in Kd,380 for three depths, July–August average, 1996–2002. Little change occurred at the depth of the deep chlorophyll maximum (100–140 m). Larger variations occurred for depths 0–20 m and 20–40 m, which showed similar changes in 6 out of 7 years. Error bars (+/- 1 S.E.) are shown for years with multiple measurements (N=2, 1996, 1998, 1999, 2002; N=3, 2001). |
 |
|
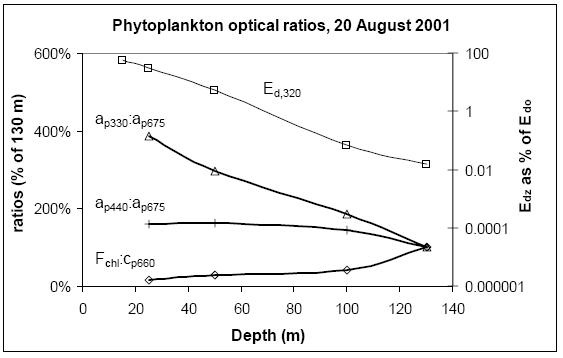
Figure 12B. Absorption ratios consistent with photo protection from UV-B in phytoplankton near the surface (MAA peak versus Chlorophyll-a red peak ratio follows attenuation trend for UV-B irradiance; Chlorophyll-a blue peak versus Chlorophyll-a red peak ratio remains constant with depth). Ratio of Fchl:cp660 shows photoacclimation as in Figure 11B. |
 |
***previous*** — ***next***