
|
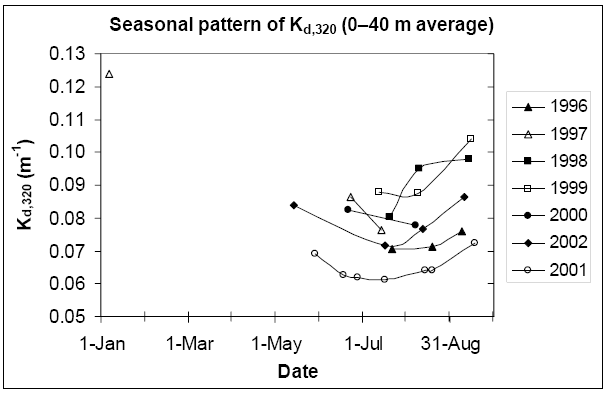
Figure 7A. Seasonal pattern of Kd,320 in Crater Lake, 1996–2002 (averaged 0–40 m). Typically the minimum Kd occurred in July or August. The highest Kd values during this period were in 1998–1999, the lowest in 2001. |
 |
|
Figure 7B. Interannual variation in Kd,380 for three depths, July–August average, 1996–2002. Little change occurred at the depth of the deep chlorophyll maximum (100–140 m). Larger variations occurred for depths 0–20 m and 20–40 m, which showed similar changes in 6 out of 7 years. Error bars (+/- 1 S.E.) are shown for years with multiple measurements (N=2, 1996, 1998, 1999, 2002; N=3, 2001). |
 |
|
Figure 8A. Crater Lake particulate organic carbon (POC, C g m-3) versus depth, 1999. POC was derived from 2 m binned cp660 data (SeaTech transmissometer). Calculation: POC = (cp660+0.024-X)/0.032)/83.3 (proxy equation from Boss et al., this issue, but X was adjusted on each date to match POC over 300–500 m for all dates). Photic zone particulate carbon appears to increase over the course of the summer. |
 |
|
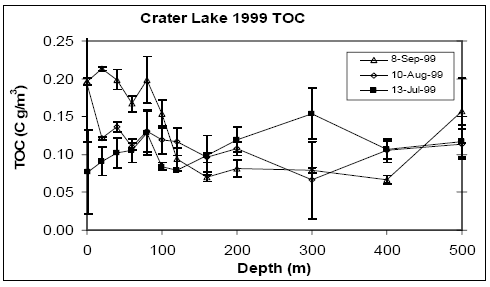
Figure 8B. Crater Lake Total Organic Carbon (TOC) versus depth, 1999. TOC (carbon g m-3) in whole water samples was determined from three analytical replicates with a Shimadzu TOC-5000 (error bars are +/- S.E.). |
 |