
Water balance for Crater Lake, Oregon by Manuel Nathenson
Water Balance Using Daily Data
With the availability of many years of daily precipitation and water-level data, a water balance during the entire year should be possible. The purpose of this section is to develop a water balance using daily data and to use averages of several year’s data to obtain appropriate values for parameters needed in the balance. Values obtained will be compared to those obtained using the yearly water balance. The basic notion that must be added to the yearly water balance is that precipitation on the rim is stored as snow during the winter and then released in the spring and early summer.
The instantaneous water balance may be written as:
![]()
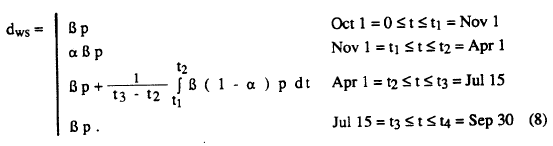
where dz/dt is the rate of change of water level with time, dws is the water supply from precipitation and inflow, and B po is the assumed constant leakage and evaporation. Although evaporation is not constant through the year, the first order variation in the water balance is assumed to be from varying water supply rather than from varying evaporation. Based on the data in Figure 4 from Redmond (1990), a reasonable model for the water supply from snow melt is that snow accumulates from November 1 to April 1. From April 1 to July 15, the snow melts at a uniform rate. Defining a as the fraction of the total water supply B p that falls as direct precipitation during the period of snow accumulation, this can be expressed as:
Many quantities could be used to match, but I will use the cumulative water supply from the start of the year. Rearranging equation (7), the cumulative water supply may be expressed as:
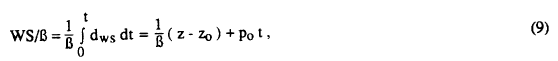
where the dependence on B is isolated by placing it on the left hand side of equation (9).From equation (8), the same quantity can be expressed as:
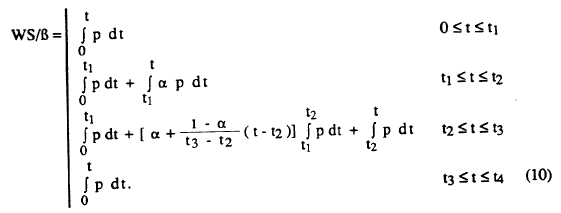
Thus the calculation of WS/B from equation (9) depends on B but not a and from equation(10) depends on a but not B. The integrals in equation (10) are converted into sums for discrete daily data.
Our objective is to choose B and a such that the cumulative water supply calculated using equations (9) and (10) are the same at every day of the year. Rather than match individual years, average years grouped by amounts of yearly precipitation (low, medium, and high) are used. Figure 2 shows the average precipitation and water level for all years with complete data. Figures 10, 11, and 12 show precipitation and average water level for years with low- (<150 cm/y), medium- (>150 & < 180 cm/y), and high-precipitation (>180cm/y). The low precipitation case maintains an approximately constant level through June and then decreases for the rest of the year because of low precipitation. The medium- and high-precipitation cases have increasing water levels through the fall and winter, relatively constant levels in the spring, and decreasing levels in the summer.