
Cruise Report: R/V Surf Surveyor Cruise S1-00-CL, Mapping the Bathymetry of Crater Lake, Oregon, 2000
Data Processing
Shipboard data processing (Fig. 9) consisted of (1) the editing the 1-Hz navigation fixes to flag bad fixes; (2) examining each ping of each beam to flag outlier beams, bad data, etc.; (3) merging the depth and backscatter data with the cleaned navigation; (4) correcting all depth values relative to the lake gage; (5) performing additional refraction corrections, if necessary, for correct beam ray tracing; (6) separating out the amplitude measurements for conversion to backscatter; (7) gridding depth and backscatter into a geographic projection at the highest resolution possible with water depth; (8) regridding individual subareas of bathymetry and backscatter into final georeferenced map sheets; (9) gridding and contouring the bathymetry; and (10) generation of the final maps. Nearly finalized maps were completed in the field prior to leaving Wizard Island and the final maps that accompany this report were completed one week after the end of the cruise.
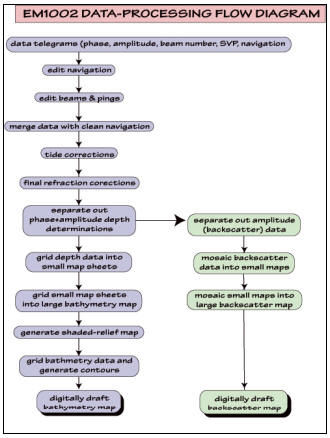 |
| Figure 9. Data-processing flow for EM1002 Crater Lake mapping. |
***previous*** — ***next***