
The Ecology and Management of Elk in
Crater Lake National Park, Oregon
National Park Service Progress Report
October, 1976, RSP CRLA-N-15A
Prepared By Tana Hill
Introduction
Elk are generally recognized as a valuable and unique resource at Crater Lake National Park. It is the responsibility of the Park Service to formulate a management plan to insure the protection and perpetuation of all resources including the elk herds. The present study is a continuation of a project begun in June, 1974 conducted by Roy Manning to survey the status of the elk herds and make management recommendations. The 1975 field work conducted by myself continued Manning’s study. The final work in 1976 concentrated in collecting observations in areas of known elk populations and in establishing elk utilization transects for continuing future management purposes.
Since the wintering grounds are primarily on National Forest Service, and private lands, and they are hunted during the fall hunting season, the National Forest Service and the Oregon State Game Commission are interested in formulating management plans for these herds. Biologists from both agencies have contributed time to the elk study and an interagency cooperative winter study may be feasible in the future. It is hoped that the results of this study will aid park biologists and administrators in better understanding the present status of elk and in predicting their probable future at Crater Lake.
I would like to acknowledge the National Park Service staff especially Superintendent Frank Betts, Superintendent Ernest Borgman, and Chief I. R. & M. Dan Sholly for their continued cooperation and interest in elk management and research at Crater Lake. Jim Blaisdell gave invaluable advice and assistance with the pellet group and vegetation use transects as well as continual encouragement. Richard Werner from the Oregon State Game Commission lent many hours assistance with the transects and Jerry Gaines, National Forest Service, loaned stock animals to haul transect stakes into the backcountry. David Wagner, University of Oregon, identified the sedges and grasses for the vegetation study. And, of course, I appreciate the company of my many friends who shared the Union Peak campfire.
Introduction
Elk are generally recognized as a valuable and unique resource at Crater Lake National Park. it is the responsibility of the Park Service to formulate a management plan to insure the protection and perpetuation of all resources including the elk herds. The present study is a continuation of a project begun in June, 1974 conducted by Roy Manning to survey the status of the elk herds and make management recommendations. The 1975 field work conducted by myself continued Manning’s study. The final work in 1976 concentrated in collecting observations in areas of known elk populations and in establishing elk utilization transects for continuing future management purposes.
Since the wintering grounds are primarily on National Forest Service, and private lands, and they are hunted during the fall hunting season, the National Forest Service and the Oregon State Game Commission are interested in formulating management plans for these herds. Biologists from both agencies have contributed time to the elk study and an interagency cooperative winter study may be feasible in the future. It is hoped that the results of this study will aid park biologists and administrators in better understanding the present status of elk and in predicting their probable future at Crater Lake.
I would like to acknowledge the National Park Service staff especially Superintendent Frank Betts, Superintendent Ernest Borgman, and Chief I. R. & M. Dan Sholly for their continued cooperation and interest in elk management and research at Crater Lake. Jim Blaisdell gave invaluable advice and assistance with the pellet group and vegetation use transects as well as continual encouragement. Richard Werner from the Oregon State Game Commission lent many hours assistance with the transects and Jerry Gaines, National Forest Service, loaned stock animals to haul transect stakes into the backcountry. David Wagner, University of Oregon, identified the sedges and grasses for the vegetation study. And, of course, I appreciate the company of my many friends who shared the Union Peak campfire.
History
The history of the elk inhabiting Crater Lake is inconclusive and controversial. Records show that a herd of 15 Rocky Mountain elk were transplanted from the Blue Mountains of Oregon to the Crater Lake area in 1917 (Ebert, 1973). These animals were from a herd that had been transplanted from Jackson Hole, Wyoming to Billy Meadows in the Blue Mountains in 1906 (Gaines, 1976). The exact location of the transplant is believed to be on the Seven Mile Creek at the site of the present Seven Mile National Forest Service Guard Station, (Zumbrum, 1976). By 1929, elk herds were seen at Mt. McLoughlin, Mt. Scott, and Red Blanket Canyon (Anonymous, 1929). The park is within the pristine range of the Roosevelt elk (Harper, 1971), and small numbers could have survived in remote areas of the park. However, Mr. Zumbrum, a resident of Fort Klamath since 1909 who traveled and trapped extensively in the local mountains, states he never saw any elk sign until the 1917 transplant (Zumbrum, 1976). Richard Werner of the Oregon State Game Commission is the most experienced in checking the hunter harvest. In his opinion most of the antlers are the narrower, longer, wider spread antler typical of the Rocky Mountain subspecies.
Since the two subspecies interbreed (Mace, 1956) crossing of the two subspecies has undoubtedly occurred. For present management concerns the subspecies question is irrelevant, but an effort should be made during future hunting seasons to obtain antlers for exact measurement to determine the subspecies.
Objectives
The basic objectives of the 1976 research were the same as in 19756. They were to determine: 1. distribution; 2. total population estimate; 3. reproduction, and herd composition; 4. migration route, and times; 5. range conditions; 6. food habits; 7. management objectives; 8. and future research potential. Since the 1975 research determined the population distribution, the 1976 field work concentrated in the Union Peak and Sun Creek sections, areas known to have the highest densities. This was done in order to increase the chances of observing elk. The study was expanded from the basic research in 1975 to the present management stage.
Methods
Observations
All observations made by the investigator, park employees, and hikers were recorded and mapped. The following observation data were collected: location, date, time, weather, habitat, total number of cows, calves, spike bulls, branch bulls, number of tracks, direction of travel, description of behavior and other details of observation. Spike bulls were defined as yearlings, forked and branched bulls as adults.
The principle observation procedure used was evening watches from Union Peak. This proved the most successful method for obtaining consistent observations. The observation period normally extended from 5:00 p.m. to sunset (7:00 p.m. to 8:30 p.m.). Binoculars (7 X 35) were used to spot animals and a spotting scope (20X – 45X power) was used to determine age and sex. Except in very windy conditions or dim light, a 30X power scope could determine spike antlers up to a mile from Union Peak. A compass azimuth reading was taken from the peak to the animals below, and later recorded on the elk distribution map.
Pellet-Group Transects
In order to obtain data on elk numbers and range conditions in future years, permanent pellet group and vegetation use plots were established. Pellet groups are cleared from the plots the first year and then counted and cleared subsequent years. Pellet group counts have been used as a management tool since 1940 (Bennett, English, McCain, 1940) and have proven their usefulness in determining ungulate population trends and days of use in a given area since that time (Neff, 1968). The method chosen for Crater Lake was the .01 acre circular plot, 10 plots per transect, totaling 0.1 of an acre per transect. Transect were placed in areas where ground surveys showed the most elk sign present. All habitat types in these areas were sampled: lodgepole pine, pumice flat, mountain hemlock, red fir, meadow, and ecotones between each type.
The ten pellet plots were placed at 50 foot intervals beginning at the second vegetation transect stake and running in the same azimuth as the vegetation transect. An 11 foot, 9 inch chain was used to measure the distance from the stake to create the .01 acre circular plot. Two or three people spaced at different intervals along the chain cleared the plot. Most of the plots were cleared of old pellets before fresh sign was present in July. The pellet groups were cleared and counted again in late September for the 1976 summer range use data.
There are several sources of error in pellet group counting. One is the discrepancy in pellet deterioration rates on different plots. Pellets in more exposed dry places looked older than other in different habitats. Even though the plots had been cleared in July, some pellets on the plots in September looked older than three months old. This led to a disagreement in counting questionable groups. It was decided to count all pellets remaining in the plot as the current summer’s product. Several fresh pellet groups were placed by transect stakes in order to observe the rate of decomposition. In subsequent years this source of error will decrease sharply since the plots have been sufficiently cleared this season. Other sources of error include disagreement in counting peripheral or scattered pellet groups, and type and density of understory. It is easier to see groups in a sparsely vegetated sandy area than in dense understory areas. Droppings strewn across the plot or occurring on the periphery were counted if more than half the group was inside the plot.
Ground Cover Survey
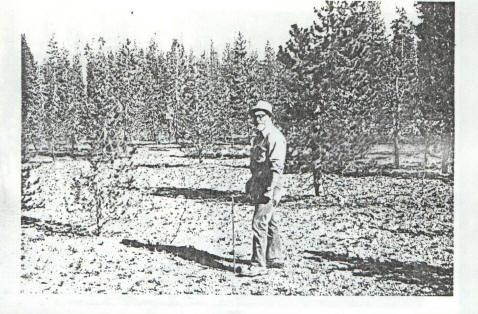
The method that was used to calculate available forage and ground cover was described by Parker in 1951 and used by the California Fish and Came Department. A 100-foot tape measure was stretched between two stakes. A plumb bob was dropped at every one foot interval and the dominant ground cover in a four inch diameter was recorded. The ground cover was categorized as bare soil, erosion pavement, (small one inch diameter pebbles with soil eroded away), rock, litter, or a plant species. If the plumb bob hit a plant directly, then that plant species was recorded. Otherwise the plant with the greatest percent cover was recorded.
Other data collected included age class (seedling, young plant, mature plant, decadent or dead plant), overstory composition, and estimated percent eaten (classified as light, moderate, or heavy utilization). Plants eaten by rodents can be distinguished because they are cut rather than ripped or chewed. It is impossible to distinguish plants eaten by deer, but in considering the few number of deer present in the particular area, this error is considered negligible. From this information it is hoped that range conditions can be determined by comp-ring the amount of plants. utilized and available.
Results
Distribution
By noting the map prepared by Jay Hoofer in 1970 (File N32), ground surveys, and recent observation data from the Winema and Rogue River National Forests, elk inhabit all available habitat at least in the winter surrounding areas outside the park. It is not known to what extent the different herds intermingle in and out of the park. This movement information could only be obtained from radio-telemetry data.
These areas outside the park are valuable winter range for elk. Most areas logged in the 1960’s provide winter forage of deerbrush (Ceanothus integerrimus, manzanita (Actotsphylos patula), and golden chinquapin (Castanopsis chrysopdlla). Other studies have shown that logging will provide new habitat for elk for about 11 years until the trees have grown (Stevens, 1965).
National Forest Service Winema District reports that every year elk are seen further south in new areas. This could be an indication of the herds increasing and migrating to new habitats.
Population Estimate
The population estimate established in 1975 was confirmed by observation in 1976 (see figure #1). Estimates calculated in 1975 for areas I, II, III are believed accurate. Although these areas had fewer observations recorded this year, the field hours spent in those areas were less, since the 1976 field work concentrated in area IV. The estimate for Area IV was believed low in 1975. During one observation, two herds totaling 44-60 elk were seen at once and probably another 30-40 animals were hidden among trees. An estimate of 80 elk is more accurate for area IV. A summary of the elk sightings are listed in Table 1.
|
Table 1. Elk sign and sightings in Crater Lake National Park, Oregon May – September, 1976. |
 |
|
Table 1. Continued. Elk Sign and Sightings in Crater Lake National Park, Oregon May-June-July, 1976 |
 |
|
Table 1. Continued. Elk Sign and Sightings in Crater Lake National Park, Oregon August, 1976 |
 |
|
Table 1. Continued. Elk Sign and Sightings in Crater Lake National Park, Oregon September, 1976 |
 |
Reproduction and Herd Composition
Herd composition gives an indication of the present and future status of the elk population (see Table 2). The figures are only an estimate since they were calculated from observations. Errors result from being unable to see the total herd simultaneously. Often the calves are not with the adult group, but with a babysitter cow or nursery group called a creche. This will often result in no calves seen with the herds. If the calf-cow ratio is calculated using the total number of cows observed, the result is 27.2:100. This number is below the average for Oregon (Harper, 1971). However, if only those groups that had both cows and calves present are counted, the ratio is 60:100. This number is high reaching the biotic potential of an elk herd. In a hypothetical population, assuming that all cows 2: years old or older breed, that one calf per cow is produced each year, and that all the animals die at age l0- years, the maximum sustained yearly natality rate would be 59 calves for each 100 cows (Stevens, 1965). Of course, this rate is never achieved.
| Figure 1. Map of Crater Lake National Park Showing elk population estimates for each area. Areas are divided by highways. |
 |
Realistically, the ratio falls somewhere between the two. When considering the inaccuracies of the technique used, the calf:cow ratios have not radically changed since 1970 and the population appears to be maintaining itself or is slightly increasing.
The herd sex and age compositions confirm the findings of other studies (Munie, 1951); (Harper, 1971); (Franklin, et. al, 1975), regarding reproductive social behavior. In June, at or about the time the cows are off by themselves and the calves are born, there were sightings of solitary cows. Later in July small (3-4 cows) and large (50-60) groups of cows with calves appeared. In late August the bulls started to appear with the cow groups and the first bugle was heard September 13, signaling the start of the rutting season.
Hunting
Hunter harvest data is available from the Rogue River and Winema National Forests. These forests border the west and south of the park and constitute the major wintering grounds of the Crater Lake elk. The number killed usually reflects the current winter weather. If enough snow has fallen in the high country by November the elk will have migrated to the lower elevations of the national forest in time for the hunting season. The spikes killed averages about 50% of the total bulls harvested in both units since 1969 (see Table 3 and 4). From this data it is assumed that the annual harvest is less than the annual reproduction. Although this evidence is not conclusive, it does give an indication that the population is maintaining its numbers.
| Table 2. Herd composition and calf:cow ratios for Crater Lake National Park |
 |
| Table 3. Rogue River Elk Season Harvest, from Richard Werner, Oregon State Game Commission. |
 |
| Table 4. Winema Elk Season Harvest from Dan Eastman, Oregon State Game Commission (only from area bordering park). |
 |
Migration Routes and Times
Before July 15 there was still 2-3 feet of continuous snow in the Union Peak area. There was very little elk sign in the area before the sighting of a large herd of about 50 on July 26 and again on July 27. By then there was only patchy snow.
As stated before, the elk migrate to lower elevations outside the park boundaries to suitable wintering grounds in the Rogue River and Winema National Forests. Clearcuts at Huckleberry Mountain, Prospect Flat, Red Blanket Canyon, and the drainages bordering the western park boundary offer suitable winter habitat.
Pellet Group Transects
It is not known whether 23 transects will yield the information wanted, but the number was chosen simply on the basis of time allotted to complete the job. Most of the pellet transects were cleared before the elk migrated into the Union Peak area. A second clearing was done before the threat of snow in late September, with the hope of securing data this first year. If the plots had been cleared only in the fall, the first count would have had to wait until 1977. A total of 404 pellet groups were cleared in September on the Union Peak transects. It is known that the average defecation rate of an elk is 12.5 pellet groups per day (Neff, et. al, 1965). It is impossible to determine the numbers of elk using the range with this information, but the total days elk used the area can be estimated. A total of 12.5 pellet groups will be referred to as one elk using the area for one day or one elk day use. With this information a total of 32.3 elk day uses over the 20 Union Peak transects can be calculated. These estimates are only useful when annual counts are compared and only when used as a relative index for that particular area. In other words, only after a pattern is developed can a change in use be detected.
Food Habits
The plant species composition of the elk range sampled in the groundcover transects is listed in Table 5. The nonproductive categories of bare soil, erosion pavement, rock, and litter averaged 71.9%o of the total groundcover for the 23 transects. This leaves 29.1% in productive vegetation ground cover.
The range is shown to be in good condition with only minimal utilization of the total plants available. There were still many areas with abundant forage available in late September, although all plots had obvious grazing signs.
Frequency is defined as: number of plots in which species occurs divided by total number of plots sampled. Plants occurring the most frequent were sedges (Carex halliana), Anderson lupine (Lupinus Andersonii), phlox (Phlox douglasii), western needlegrass (Stipa occidentalis), squirreltail (Sitanion hystrix), and dirty socks (Eriogonum pyrolaefolium). However, these are not necessarily the ones utilized by elk.
The plant species of primary food importance are the following: dirty socks (Eriogonum pyrolaefolium), Newberry knotweed (Polygonum newberryi), pumice sandwort (Arenaria pumicola), pussy paws (Spraguea umbellata), western needlegrass (Stipa occidentalis), sulfur buckwheat (Eriogonum umbellatum), Anderson lupine (Lupinus Andersonii). Two plants, parryi sedge (Juncus parryi) and smooth woodrush (Luzula glabrata), were moderately grazed outside the transects. All species grow in the open meadows, except smooth woodrush, which is the most abundant herbaceous plant under the red fir and mountain hemlock forest.
| Table 5. Plant species composition for elk ground cover transects numbers 21-43, September, 1976. |
 |
* This plant has been sent to a Carex specialist by David Wagner. It is believed to be a new species for the park.
Recommendations
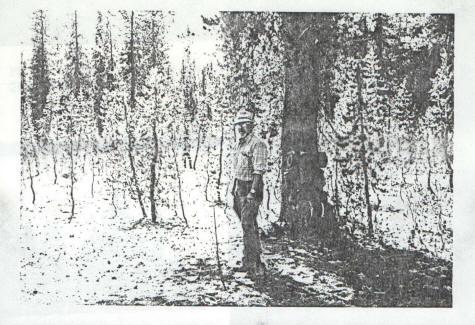
The prime elk habitat in the park consists of meadows intersperced with mountain hemlock (Tsuga mertensiana) and Shasta red fir (Abies Magnifica var. Shastensis). Maintaining these habitat types would be beneficial to the elk. It is apparent from casual observation that the meadows are being encroached upon by lodgepole pine. Some meadows have already disappeared and have been replaced by lodgepole 6-10 feet tall. Whether this plant replacement is a natural phenomenon such as soil nutrient caused or an unnatural phenomenon such as fire absence caused is a question that will be answered only by more technical research. The final report from Robert Ziegler concerning the lodgepole succession should be carefully evaluated for recommendations concerning the elk habitat. If the succession is fire caused perhaps a tree removal program in order to insure the future of the meadows habitat would be advisable. Fuel content and understory is very slight so there is little chance that a prescribed burn would be successful.
It is advised that at least two weeks a year be devoted to collecting data on the ground cover and pellet group transects. This should be done by a well-trained individual, preferably the same person for as many years as possible. Two or three people are needed to check the transects accurately. During this two week period, daily elk observations should be made from Union Peak. The transects are a long term management tool and should be monitored faithfully. Trends from the data will begin to show only after about five years.
Elk sightings should be mapped every year and a record kept of the cow: bull:calf ratios. The annual hunter harvest from Rogue River and Winema National Forest Service districts should be tallied. With this information the herd status could be compared with past years and any change in the population could be detected. This could be a routine duty of the regional research biologist.
There should be a poaching patrol on the west and south boundaries during elk season. Local hearsay shows evidence of poaching near Stuart Falls, Varmit Creek, Thousand Springs, Deer Creek, Rock Creek, Copeland Creek, Bybee Creek, and Sun Creek. Backcountry rangers should always be alert for poachers during the summer as there are local people who consistently hunt in the park.
Illegal cattle grazing on the northwest section of the park is of primary concern. Their presence over the years has made considerable impact on the environment. Evidence of soil erosion, established cattle trails, and overgrazing is quite evident and appalling. Elk are occasionally sighted in that area and one wonders what impact the cattle have in terms of competition and habitat destruction. The strong position toward the cattle owners that was taken this year should be continued and a program should be implemented to rid the park of illegal grazing.
Future Study
Many questions are still left unanswered regarding the Crater Lake elk population. Questions regarding migration, general health, daily movements, and home range are very important to the understanding of the herds. A research program of tagging and radiotelemetry has been used in other studies to gain information on these questions. A similar program was evaluated for use at Crater Lake. A summer trapping program would be difficult since there is abundant food available. Bait of oats, salt, and alfalfa were set in areas where elk were known to frequent, but only one elk was attracted after three weeks. Immobilization through use of a tranquilizer gun without trapping would be one alternative but this would involve considerable manpower and time. Two or three full time people with horses would be needed for such an undertaking. Trapping on the wintering grounds would have higher chance of success but the logistics of manpower and equipment on unplowed roads would be expensive. If a study could be developed to include the National Forest Service or Oregon State Game Commission this plan might still be feasible.
In considering the difficult research situation, limited budget, and that the population is neither threatened nor overpopulated, it is recommended to not undertake a tagging program at this time. Data from the pellet and ground cover transects and observations should yield additional information about the population. After monitoring the transects for five years the situation can be reevaluated. Only if there is some change noted would additional intensive study be warranted.
Conclusion
A survey of the elk population of Crater Lake National Park that was started in 1974 was concluded during the summer season (June li-October 2) of 1976. A total population estimate of 159 was concluded from observations and track records. From annual hunter harvest data and calf:cow ratios it is assumed that the population is maintaining its numbers. Twenty-three permanent pellet group and ground cover transects were established in order to obtain information on elk habitat use patterns and range conditions for future management purposes. The preferred food plants of the elk were determined. The range was found to be in good condition, with only a light degree of plant utilization. It was recommended to continue the collection of data from the transects for the next five years, at which time the situation should be re-evaluated. There should be a poaching patrol during hunting season and illegal cattle grazing should be eliminated. Maintaining the meadow habitat type is beneficial to the elk and the disappearance of the meadows due to plant succession could be a concern for future elk management.
Literature Cited
Bennett, L. J., P. F. English, and R. McCain, 1940. A Study of deer populations by use of pellet-group counts. J. Widl. Mgmt. 4(4): 398-403.
Ebert, Paul, 1973. Correspondence with Michael McCollum. File N22.
Franklin, W L., A. S. Mossman, and M. Dole, 1975. Social organization and home range of Roosevelt elk. J. Mamm., 56:102-118.
Gaines, Jerry, 1976. Correspondence with Tana Hill. File N22.
Harper, J. A., 1971. Ecology of Roosevelt elk. Pittman-Robertson Project W-59-R and Division of Wildlife Research, Oregon State Game Commission, Corvallis, 44 pp.
Hill, Tana, 1975. The Ecology and Management of Elk at Crater Lake National Park, Oregon, NPS Progress Report RSP-CRLA N 15A
Mace, R. U., 1956. Oregon’s Elk. Oregon State Game Commission Wildlife Bulletin No. 4, 33 pp.
Murie, O. J., 1951, The Elk of North America. TI Stackpole Co. Harrisburg, Pennsylvania, and the Wildlife Management Institute, Washington, D.C. 376 pp.
Neff, D. J., 1968. The pellet-group count technique for big game trend, census, and distribution: a review. J. Wild-Mgmt 32(3): 597-614.
Neff, D. J., 0. C. Wallmo, and D. C. Morrison, 1965. A determination of defecation rate for elk. J. Wildl. Mgmt. 29 (2): 406-407.
Parker, Kenneth W., 1951. A method for measuring trend in range conditions on national forest ranges. USDA 20 pp.
Stevens, Marshall Calvin, 1965. A preliminary study on the movement, distribution, abundance, and sex and age composition of the Roosevelt elk in and adjacent to the Prairie Creek Redwoods State Park. M.S. Humboldt State.
Zumbrum. 1975. Personal communication.
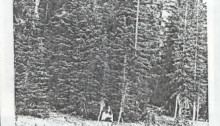
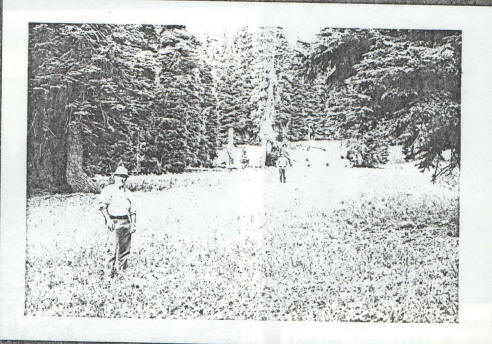
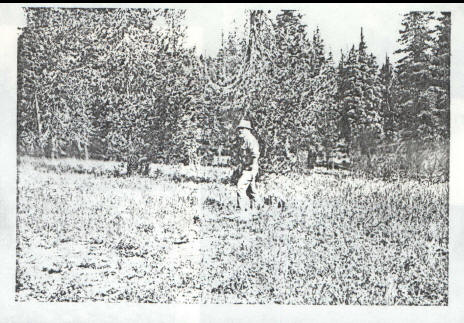
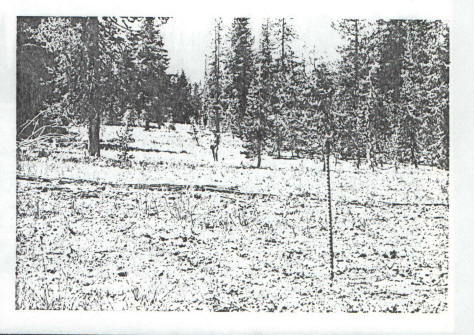
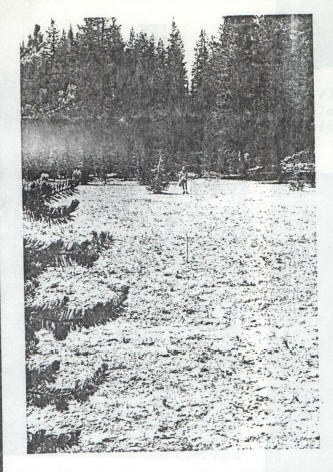
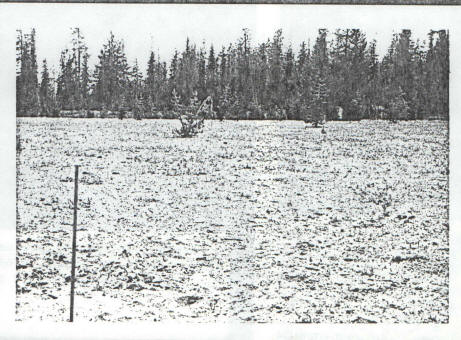
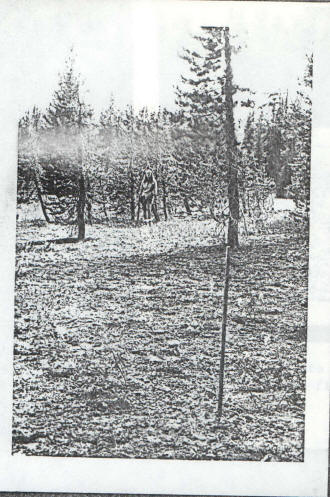
Field Photos
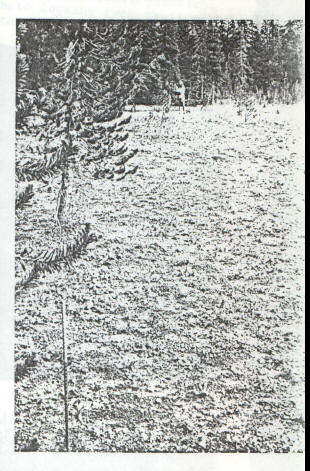
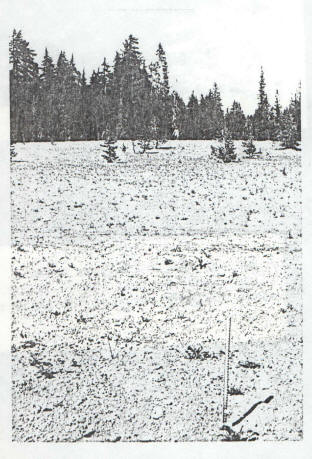
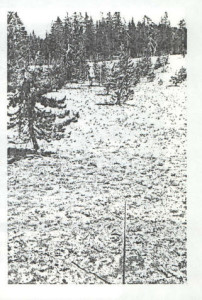
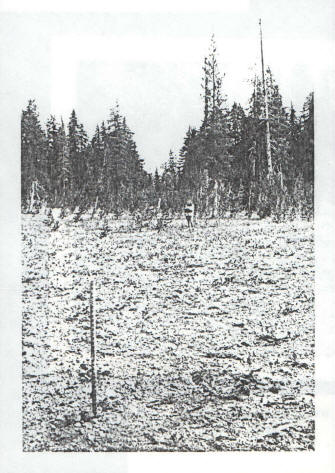
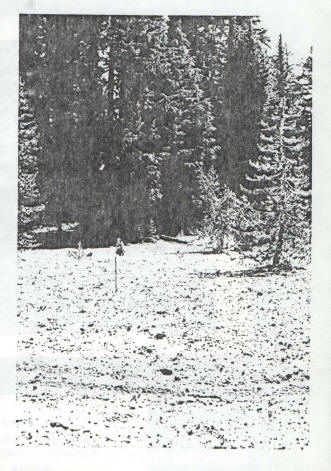
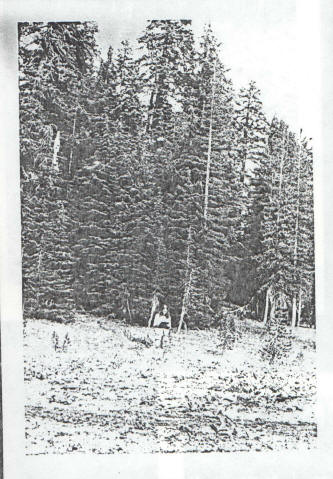 #21. 2.8 miles south on Pacific Crest Trail from Hwy. 62, .1 m. s. of-PCT/ fire road 29 junction. Photo looking from trail marker stake 102 degrees to first transect
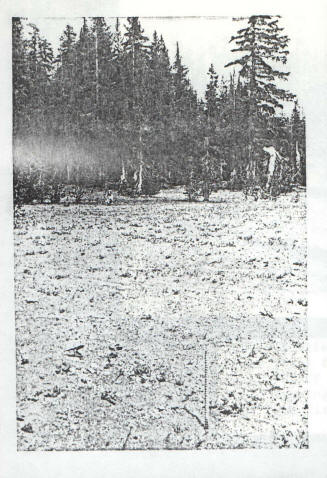
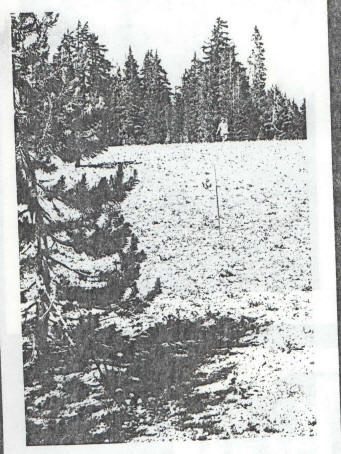
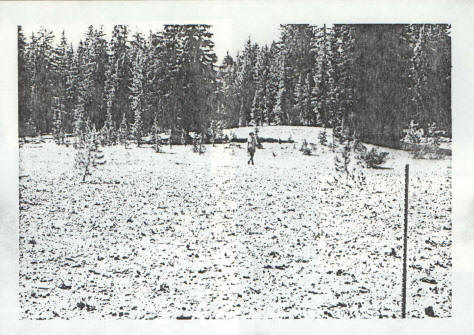
#22. 3.1 miles south on Pacific Crest Trail from Hwy. 62, .1 m. S. of PCT/UP trail junction. Photo looking from trail marker stake 86 degrees to first transect stake.
#22. Photo looking down transect line, 190 degrees from first transect stake.
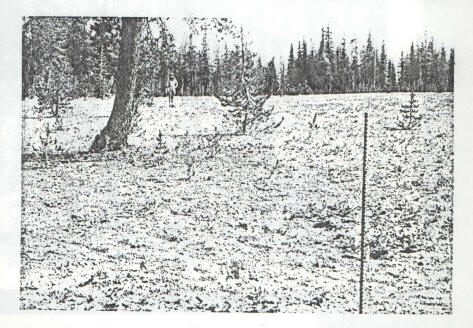
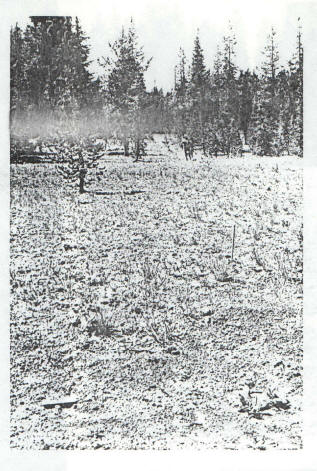
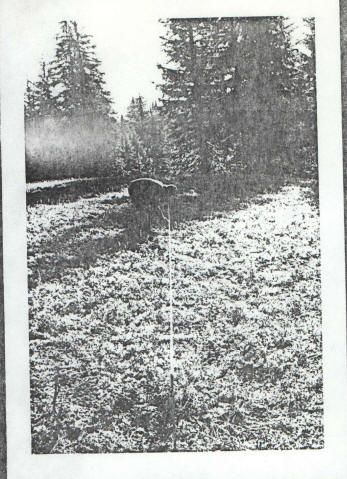
#23. 3.5 miles south on Pacific Crest Trail from Hwy 62, .3 m. s. of PCT/UP trail junction. Photo looking down transect line, 130 degrees from first transect stake.
#24. 3.6 miles south on PCT. Photo looking down transect line, 256 degrees from first transect stake.
#25. 4 miles south on PCT. Photo looking down transect line, 256 degrees from first transect stake.
#26. .2 miles east of PCT/UP junction on UP trail. Photo looking from trail marker stake 28 degrees to first transect stake
#26. Photo looking down transect line, 20 degrees from first stake.
#27. .2 miles west of PCT/UP junction on UP trail. Photo looking from trail marker stake 65 degrees to first transect stake.

#27. Photo looking down transect line, 112 degrees from first stake.
#28. 3/4 mile west of PCT/UP junction on UP trail. Photo looking from trail markers stake 141 degrees from first stake.
#29. 1 mile west of PCT/UP junction on UP trail. Photo looking down transect line 107 degrees from first stake.
#30. 1 mile west on fire road 25 from Et2T/road 25 junction. Photo looking down transect line, 260 degrees from first stake.

#31. 1 mile west on fire road 25 from PCT/road 25 junction. Photo looking down transect line, 202 degrees from first stake.
#32. 1.3 miles west on fire road 25 from PCT/road 25 junction. Photo looking down transect line, 8 degrees from first stake.
#33. 1.5 miles west on fire road 25 from PCT/road 25 junction. Photo looking down transect line, 20 degrees from first stake.
#34. Parallel to transect #21. Photo looking from trail marker stake 102 degrees to first transect stake.
#35. At PCT/UP junction. Photo looking from trail marker stake 298 degrees to first stake.
#35. Photo looking down transect line, 298 degrees to first stake.
#36. Photo looking from marker stake, 292 degrees to stake.
#36. .1 mile south of PCT/UP junction. Photo looking down transect line, 222 degrees from first transect stake.
#37. Parallel to transect #36. Photo looking down transect line, 222 degrees from first stake.
#38. .2 miles west of PCT/UP junction on UP trail. Photo looks from trail marker stake 197 degrees to first transect stake.
#38. Photo looking down transect line 289 degrees from first stake.
#39. 1/3 mile west of PCT/UP junction on Union Peak Trail. Photo looking down transect line, 328 degrees from first stake.
#40. 1 mile west of PCT/UP junction on Union Peak Trail. Photo looking down transect line, 102 degrees from first stake.
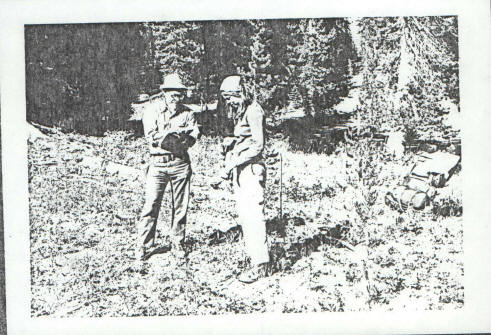
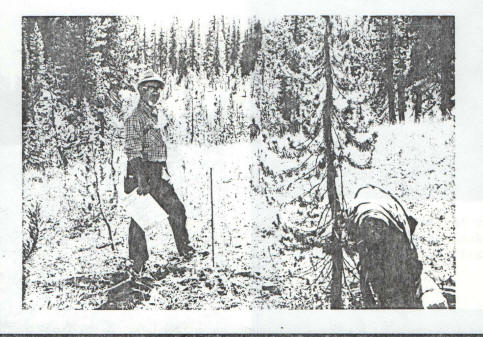
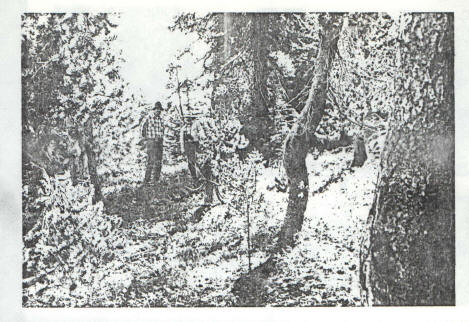
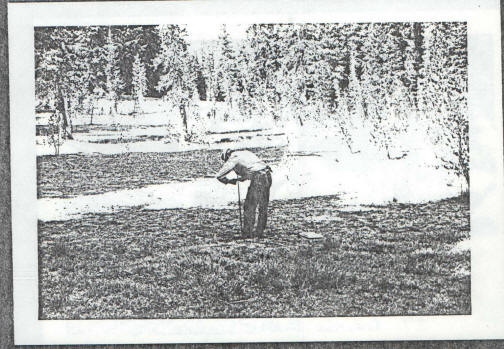
Demonstrating ground cover transect technique with tape measure and plumb bob.
Other pages in this section
*** previous title *** --- *** next title ***